SabrStros

  • Jose Altuve, Alex Bregman, and the Power of Pull

    January 19th, 2023

    Astros fans know better than to doubt Jose Altuve. The Houston legend has provided countless memories over his long career and will go down as one of the best Astros ever. While his 2022 postseason was underwhelming (a fact that did not deter Houston from getting its ring), his regular season was outstanding. In fact, by wRC+, it was Altuve’s best offensive season of his career. Better than his MVP season. While .300 felt like a given for younger Altuve, he hit exactly that mark for the first time since 2018. He did that while keeping his power up to par from the past couple full seasons. Is that production backed up by the underlying numbers?

    This is a question that doesn’t need to be asked about the Altuve’s of the world. He has proven himself more than enough for people to question if his success if “real.” Still, there was a cavernous 43 point gap in his wOBA (weighted on base average) and xwOBA (expected weighted on base average) in 2022. He got lucky?

    Well, no one “lucks” their way into a 6.6 WAR season. However, the difference between his expected stats and his actual stats is not new. Aside from that shortened 2020 season, Altuve has consistently outperformed his expected numbers.

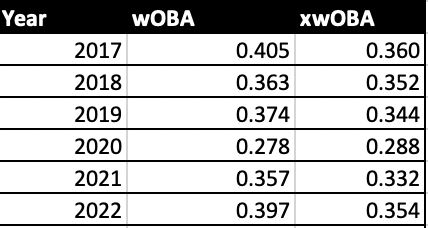
    Since the start of 2017, Altuve has the 2nd largest gap in the MLB between actual and expected stats (minimum 1500 PAs). However, if it’s unwise to say Altuve built his 2022 season on luck, it’s even more ridiculous to suggest he’s built the entire latter half of his career on luck. He certainly isn’t just coincidentally beating his expected stats every year.

    A few years ago, I marveled at Alex Bregman’s homerun totals. He hit 72 across 2018-19. While Altuve gets plenty more fanfare for power given his stature, Bregman is by no means an imposing slugger. Yet, he managed to rise towards the top of home run leaderboards. Bregman was ninth in total homeruns.

    In August of last season, Eno Sarris of The Athletic reported that Bregman told him he’d hit 20 homers the rest of the season, or at least 20 doubles. The pulled fly balls would come back. The key! Back in his home run peak, Bregman actually led the league in pulled home runs in 2018-19. Like Altuve, Bregman produced massive wOBA-xwOBA splits in that span of time.

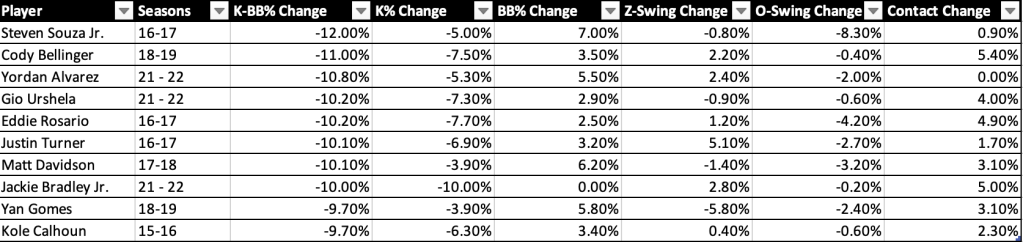
    Of players who hit at least 25 home runs combined across 2018-19, Bregman ranked 195/198 in average exit velocity. Remarkable considering he ranked 7th in total home runs hit. During Bregman’s ascension, lifting balls to the pull side was the name of the game in baseball. Combine that with the juiced ball and many players with no expectation of big power began putting up big home run totals. Bregman was the king of that. Examine some of Bregman’s numbers below:

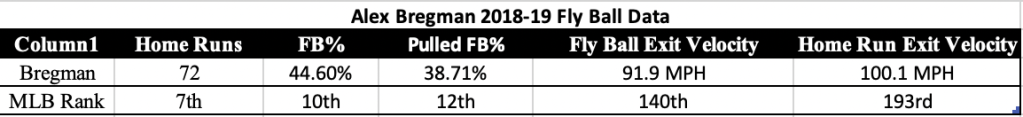
    Bregman racked up homers in bunches, hitting a ton of fly balls and pulling a lot of them. On average, they didn’t leave the bat with much thump. That becomes more of a bonus than a requisite if you utilize park size. The fences are almost always at their closest down the foul poles. While no home runs are weakly hit, almost any professional baseball player can hit the ball say, 98-100MPH off the bat. Not everyone can consistently hit the ball 105+ MPH. If achieved at the right launch angles and direction, those 100MPH EV’s can often suffice just as well for power production.

    That’s where the expected stats come into play. Statcast expected stats take the launch angle and exit velocity of a batted ball. Using prior batted balls similar to those values, they assign the expected wOBA from the probability the batted ball falls under each possible outcome. The odds that a batted ball is an out, a single, a double, etc. It does not consider directional or park factors. A fly ball down the left field line at Minute Maid is far more likely to leave the park than one towards dead center. Simply, a player can outperform their expected fly ball numbers if they can consistently pull the ball in the air.

    Did Bregman just mostly take advantage of the Crawford Boxes? He actually hit 40 on the road, compared to his 32 at home. His strategy was successful everywhere. It isn’t just the short Minute Maid porch. I haven’t stopped marveling at Bregman’s power success since looking at his numbers during the 2019 season. That success is what led me here to Altuve.

    As he has aged, Altuve has consistently changed his game. The adaptability is an impressive trait, yet a necessary one to continue to have top-5 MVP seasons into your mid-thirties. While we may never see him hit .320+ again, he’s been quite successful in other factors the past couple seasons. A major part of this sustained success is a batted profile that looks quite different:

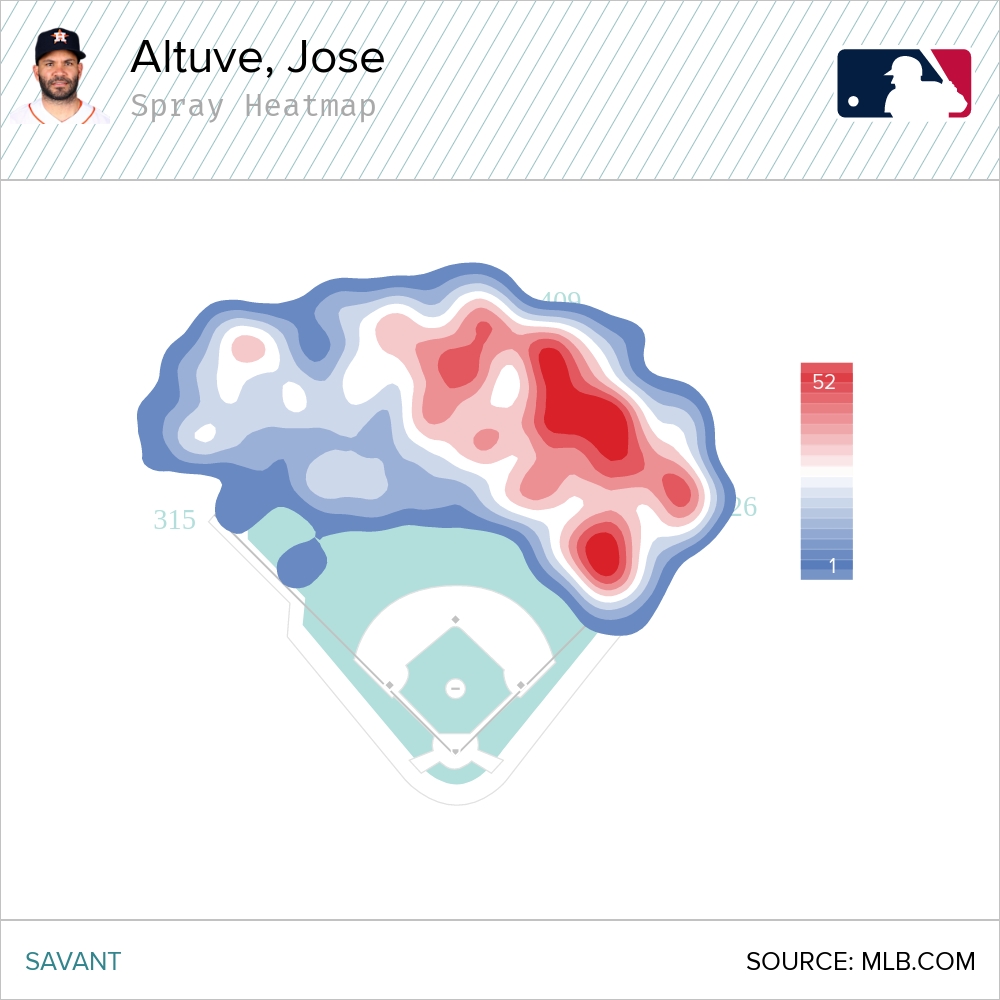
    A lot of opposite field fly balls! That’s not uncommon, and it certainly didn’t prevent Altuve from succeeding in those years. Next, the same chart, but from the 2021-22 seasons:

    The sample size is roughly half as large, so the data isn’t as tightly packed. Nonetheless, the shift from opposite field to pulled fly balls is striking. Altuve made a conscious effort to get around the ball in the air – a change from the younger version of himself.

    There were hints of this in 2019, at least in the pull rate. Altuve – like the many in the league – ran a massive HR/FB with the juiced ball. The returns from that combo were 31 home runs. I tend to not put much weight into 2020 with the sample size.

    2021 was a big step for the current Altuve. His fly ball rate spiked, and he ran a career high in pull rate. This returned another 31 homer season in a less advantageous offensive environment. However, his infield fly ball rate skyrocketed. He was the worst player in the league in that department, and his BABIP suffered as a result. In 2022, he remained on track with his pulled fly balls and limited the pop ups. Altuve combined that with a career low chase rate to ultimately put up arguably the best offensive season of his career.

    Similar to Bregman, he hasn’t’t been successful by consistently crushing the ball. Since the start of 2021, Altuve ranks 20th in total home runs. He ranks 157th in home run exit velocity. His average exit velocity ranked among the likes of Miguel Rojas and Owen Miller in 2022. The overall batted ball numbers indicate a player with little to no pop. Yet, Altuve remains as productive as ever.

    It’s quite an encouraging sign for a player about to enter his mid-thirties. He’s figured out how to marry pull power and patience. He still hardly strikes out. That’s a profile that could age quite well. Pulled fly balls have a very high correlation with success, and Altuve can fight other diminishing abilities by continuing to utilize it. Altuve and Bregman are both great examples of tapping into home run power while lacking the natural strength to consistently hit the ball hard. It’s a skill that will serve both of them well in the future if they are able to consistently harness it.

  • Cristian Javier and Getting In Front

    December 21st, 2022

    For Cristian Javier, it’s always been about the fastball. If anyone watched the Game 3 World Series broadcast, you probably caught on how to the constant discussion of his riding 4-seamer. The one dubbed the “Invisiball” for it’s unique deception.

    If it’s always been about the fastball, it’s also always been about the strikes. Javier rode that fastball success to exceptional strikeout numbers in the minors, pushing him up the Astros minor league rankings as an unheralded international signing. He also walked more than 10% of batters faced at almost every level of the minor leagues. He was able to limit those walks in his first season in 2020, but his strikeouts dipped and he gave up far too many home runs. In 2021, Javier became the long relief ace. Still, he walked too many guys and gave up too many home runs. In 2022, he cut the walks down and slashed the home run rate. He improved all his numbers across the board, despite an increased workload. One stat in particular stood out to me.

    As I mentioned above, Javier actually limited his walks in 2020, relative to his minor league numbers. But it certainly was not due to first-pitch strikes. Of every pitcher who threw at least 30 innings (half of what’s necessary to qualify), Javier was dead last in starting off an at-bat in his favor. The quality has remained:

    Minimum 80 inning in 2021 and 2022 (roughly 50% of innings needed to qualify)

    In 2022, there was improvement! He threw more first-pitch strikes and cut his walk rate. Even still, he remained close to the bottom of the league in the former. How is Javier able to remain so successful while struggling to get ahead?

    I will preface this analysis by noting that a first pitch strike is not a great barometer for overall success. It does have some general correlation with walks, but, depending on a pitcher’s approach and arsenal, it really could mean nothing. Patrick Corbin ranked third in first pitch strikes in 2022. I don’t think I need to lead you any further there. However, you generally are not finding the leagues aces at the bottom of this stat, and Javier has tended to operate at the extremes here in his career. So, let’s take a look how he has gotten here.

    We’ve already alluded to Javier and his famous fastball. It’s a fantastic pitch. He throws it often – about 59% of the time. The connection there is simple. In a 0-0 count, a count that leans towards strike-throwing, one might expect Javier to focus on his great fastball. He doesn’t:

    Minimum 25% Four-Seam Fastball Usage

    Javier’s fastball usage actually falls to about 50% on the first pitch. The above graph demonstrates how Javier separates himself from the group. Especially with guys who utilize their four-seamer more, it’s not often they change that tendency significantly in blank counts. Javier is different.

    Besides being one of the best pitchers in baseball, Javier sets himself apart in another fashion. He’s one of few pitchers able to get by while relying almost entirely on two pitches. It’s generally accepted that a starter needs at least three reliable pitches to thrive – not the case for Javier.

    Javier has a curveball he throws around 8% of the time. It’s the third pitch in his arsenal, albeit not throw that often. If you take a closer look, not a lot sets the curveball apart from his slider:

    The curveball is identical by its horizontal movement, but has extra bite compared to the slider. Javier takes off about three mph from the slider to the curve. It is a materially different pitch, but no one would fault you if you confused some of the breaking balls while watching a Javier start. The curveball did set itself a part in certain facets.

    For one, over 90% of its usage was to lefties. That isn’t particularly strange. Plenty of pitchers have a pitch that they use almost exclusively to neutralize a platoon disadvantage. However, of all those curveballs to lefties, around 35% came in that 0-0 count. Javier threw about as many first-pitch curveballs as he threw in any two-strike count. While it was thrown sparingly overall, Javier had a clear purpose for his curveball. Balancing his arsenal to try and pick up strikes on lefties. Did it work? More on that later.

    The curveball fits into a larger overall picture. A picture that indicates Javier likes to pitch a little backwards. It wasn’t just the curveball to lefties. He threw plenty of first-pitch sliders to lefties. Against righties, Javier favored the slider to the fastball. Javier’s breaking balls are meant to be the setup for the fastball, rather than vice-versa. With two-strikes, only Spencer Strider and Brandon Woodruff threw a higher percentage of fastballs. This isn’t an unheard of way of pitching, but it’s certainly unique.

    Is Javier particularly adept at picking up strikes with his breaking balls? Well, as we discussed at the beginning of the article, it does not seem that way. Javier has been at the absolute bottom of the league at getting strikes on the first-pitch. I don’t think that matters to Javier. After this year, I don’t think it should matter to us either.

    Consider Javier’s fastball. It neutralized hitters in many facets. Impressively, it was nearly untouchable inside the strike zone. Javier threw 832 fastballs in the strike zone this season, 18.5% of which generated a whiff. Only Eric Lauer surpassed that among starters. This begs the question – how significant is it for Javier to be ahead in the count early? Most pitchers want to avoid throwing a fastball in the strike zone while behind in the count. Hitters can sit on that. Javier doesn’t have to worry about this situation nearly as much as others. Even if they’re sitting on it, his fastball is still so difficult to hit. Missing with those early breaking balls just isn’t that much of a drag on overall performance for Javier.

    Javier loves his fastball. The way he mixes it in with his other pitches is different. Against conventional pitching tendencies, Javier throws more breaking balls early and finishes batters off with his fastball. A lot of those breaking balls miss the strike zone. As a result, he may end up in more 1-0 counts than most pitchers. With the results he put on the table this year, he proved that doesn’t matter.

  • Yordan Alvarez’s Unique Improvement

    December 1st, 2022

    If Yordan Alvarez were to never take another swing in a professional baseball game, his legacy would still linger in the minds of Houston Astros fans for years to come. When Alvarez turned World Series Game Six, and Minute Maid Park, upside down on November 5th, he took a poetic trot around the bases for the final time that season. The monstrous 450-foot shot didn’t quite end the game, but it certainly seemed to put it out of reach. It was the perfect bookend to the Astros’ postseason run – one that began 25 days earlier with a historically improbable walk-off from that same man. For Alvarez, it was a postseason attached to perhaps the best offensive regular season by an Astro since Jeff Bagwell’s MVP. While his collective postseason performance may not have matched that of the regular season, the moments he provided certainly did.

    It is always important to go back and appreciate what occurred during the 162 game grind to ultimately get to those special moments. Possibly overshadowed at times by Aaron Judge’s AL home run record chase (and understandably so), Alvarez put together an incredible regular season of his own on his way to a third place finish in AL MVP voting.

    Alvarez was already great. Any casual baseball fan could see that. He burst onto the scene with 27 home runs in 87 games as a rookie in 2019. After knee surgeries kept him out of the shortened 2020 season, he followed up that rookie year with a strong 137 wRC+ in the 2021 season. In 2022, he finished with a 185 wRC+, a top-ten single season mark since the retirement of Barry Bonds. How, though, did Alvarez elevate from great to transcendent?

    Alvarez had already established himself in the slugger department with his massive home runs and gaudy batted ball data. It was his plate discipline numbers that ultimately put him over the top in 2022. He increased his walk rate from 8.4% to 13.9%. He cut his strikeout rate from 24.2% to 18.9%. Making gains of that level in both departments is quite impressive. It is fair to assume that anyone who improves both their walk and strikeout rates by over 5% has also improved their overall batting line.

    I looked into the significance of Alvarez’s improvement within the context of recent baseball. Beginning with 2015 (the start of the statcast era), I examined the largest year-to-year improvements in K-BB% (minimum 350 plate appearances – both seasons). The lower the better here. Omitting 2019 to 2020 or 2020 to 2021, due to the shortened season. This is what the top-ten leaderboard looks like:

    Out of 873 such season-to-season samples, Alvarez’ improvement from 2021 to 2022 is the third largest. Combine that with batted ball data that looks like this:

    It’s not difficult to envision how Alvarez finished second in baseball in both wOBA and wRC+.

    As mentioned earlier, such improvements in your walk/strikeout rates generally indicate x player improved their overall offensive contributions. Improvements of this magnitude also generally point towards a player’s approach and contact abilities improving. These things are not perfectly correlated, but they’re probably the first place to visit when examining a change in plate approach. Below is the leaderboard with the same players above, now showing their underlying plate numbers:

    Z-Swing/O-Swing: Changes in Swing Rate at Pitches In and Out of the Strike Zone

    Alvarez improved his discipline at the plate. He swung at more strikes and at fewer balls, a change that almost always leads to improved results. His contact rate did not change at all. When you examine the results around this leaderboard, Alvarez changes at the plate overall are less pronounced than other players on the list. Cody Belling significantly improved his contact ability. Steven Souza stopped swinging at so many balls. Matt Davidson and Yan Gomes did both. What accounted for Alvarez’s improvement?

    Your first thought may be intentional walks. And yes, these intentional walks did play a factor. Alvarez was performance proved he was quite worthy of them. Alvarez was intentionally walked three times in 2021 as opposed to nine times in 2022, with fewer plate appearances in 2022. However, his rate still increased a sizable 4.45% when omitting the intentional ones.

    With every plate appearance that does not result in an automatic free pass, there is a story. The result may look the same in the box score, but the pitcher and hitter battle. Sometimes it is easily won – other times not. So, I examined the manner in which Alvarez has achieved his walks the past two seasons. Here are his walks by count, in 2021 and 2022:

    Even if they don’t waive the white flag immediately, pitchers will sometimes still proceed with extreme caution against certain hitters. This seemed to be the case many times for Alvarez this past season. Rather than finding himself in a full count for most of his walks, he was often able to take the easy pass on 3-0 and 3-1 counts. Below is the zone rate of pitches to Yordan Alvarez, broken down by count:

    Down 3-1, pitchers were significantly more cautious this season. In 3-0 counts, they were downright terrified of Yordan Alvarez. Less than half of the pitches he saw in 3-0 counts were in the strike zone. For reference, in the midst of one of the most dominant offensive seasons in recent memory, Judge saw 70% strikes on 3-0. Pitchers essentially threw in the towel against Alvarez once they were put in serious hitter’s counts. That made walking a much easier task for Alvarez.

    Now, shifting to Alvarez’s strikeouts. As seen above, his contact rate remained stagnant. His overall swing rate remained stagnant. He didn’t go into full protect mode with two strikes. He actually swung 8% less often down 0-2, and his other two strike swing tendencies had no noticeable difference. Perhaps he took advantage of hittable pitches early in the count. So, I took a look at his swing tendencies at pitches thrown inside the strike zone, broken down by count:

    The biggest discrepancy comes in 2-1 counts, where he was actually much more willing to watch strikes pass by. He was also less eager up 2-0. Considering how pitchers treated him in three ball counts, that makes sense. He was also much more aggressive on strikes in 1-2 counts. The 1-0 and 1-1 hitting have big changes in opposite directions, which doesn’t mean he was particularly more aggressive when seeing strikes early in the count. The tendencies overall don’t point towards any overarching trend of Alvarez jumping on hittable pitches early.

    When researching such massive changes for players, it often feels like it can’t be so simple. In 2021, 54.2% of his at-bats reached a count with two-strikes. In 2022, Alvarez cut that number to 47.8%. The MLB average was 53.5%. You can’t strikeout without two strikes on you. Sometimes, maybe it is that simple: Alvarez didn’t put himself in position to strikeout as often. Perhaps Alvarez cleaned up his swing decisions just a bit, spit on a few more pitches outside the zone, and everything clicked from there.

    It is worth noting his two-strike hitting was a sort of catalyst for his season. He didn’t end up there nearly as often, but he made the most of it when he did. In his solid 2021 campaign, he struggled in those situations, relative to his overall achievement. In 2021, he ranked 153rd in the MLB with a .239 wOBA with two strikes. Last year, he ranked 27th in the MLB with a .289 wOBA (both min. 300 PAs). He also struck out 5% less often in those situations.

    Yordan Alvarez was incredible in 2022. In his second full MLB season, he added on to his unbelievable batted-ball numbers to become a complete player. How did he do it? He took more efficient walks, as pitcher’s shied away from him in hitter’s counts. He put himself in a position to strikeout far less often. When he did end up in those two-strike positions, he improved to still remain a dangerous hitter. With that improvement, Alvarez brought a World Series, along with plenty of memories, back to Houston.

  • Hello World!

    November 18th, 2022

    Welcome to WordPress! This is your first post. Edit or delete it to take the first step in your blogging journey.

Blog at WordPress.com.


Loading Comments...
 

    • Subscribe Subscribed
      • SabrStros
      • Already have a WordPress.com account? Log in now.
      • SabrStros
      • Subscribe Subscribed
      • Sign up
      • Log in
      • Report this content
      • View site in Reader
      • Manage subscriptions
      • Collapse this bar